In the lead up to mating this year, we took a look at how cycling rates were tracking on some of our farms in Southland and South Otago that are using wearable technology.
These graphs show the percentage of each herd cycling in the weeks prior to their planned start of mating (PSM). We’ve pulled out the heifers (first calvers) to compare them against the overall herd (the herd data is inclusive of the heifer’s data). As expected, heifer cycling rates exceeded overall herd cycling rates on most farms.
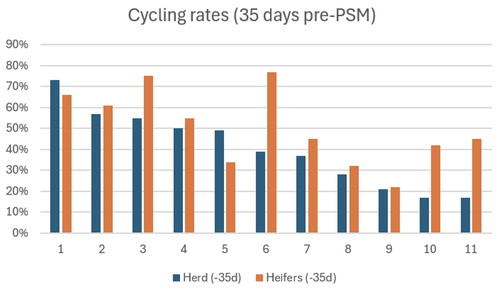
The average cycling rate on these farms 5 weeks pre-mating was 40% for herds and 50% for heifers.
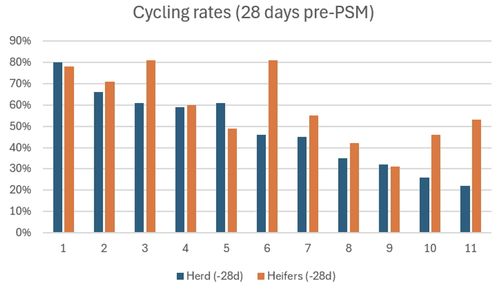
At 4 weeks pre-mating, the average cycling rate was 48% for herds and 59% for heifers.
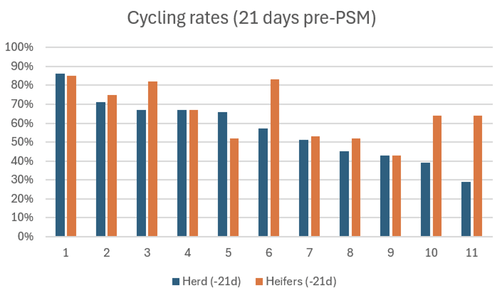
By 3 weeks pre-mating, the average cycling rate on these farms was 56% for herds and 65% for heifers.
The majority of farms we looked at were ahead of where they were at the same stage last season, which is a positive sign for upcoming submission rates, but as you can see there is a lot of variation between farms!
There are many factors at play when it comes to cycling rates, including:
Cow condition and nutrition – did they reach pre-calving body condition targets? How did they transition and was much condition lost post-calving?
Youngstock management – were the first calvers well grown?
Heifer management – how have first calvers handled their transition into milking? Have they received any special treatment to support them, such as being milked once a day or managed in their own herd?
Calving spread of heifers and cows – has a long spread delayed return to cycling?
Overall health, i.e. calving troubles, metabolic issues, mastitis.
If you want to improve the cycling rates of your herd next season, have a discussion with your KeyVet.